Now booking 3 partners for Q3 2026

We build ad systems
that actually
pay for themselves.

Performance growth for ecommerce founders who are done with agency promises and ready for the math to actually work. We turn ad budgets into engineered, predictable revenue — taking brands from five-figure months to seven-figure years with systems that compound, not campaigns that hope.

One partner. One Tuesday: $20,055.22 in revenue · 272 orders · +527% daily lift · Industry avg: nope.
Keep scrolling for the math
Peak ROAS
9.83×
Industry avg: 2-3×
Avg cost per purchase
$15
Industry avg: $25-40
Returning customer rate
41%
Industry avg: ~27%
Best single-day revenue
$20K+
Real Shopify day · +527% lift
Meta Ads Google Shopping Performance Max TikTok Klaviyo & Email Server-side tracking SMS lifecycle Meta Ads Google Shopping Performance Max TikTok Klaviyo & Email Server-side tracking SMS lifecycle
The Vishani Media System

We don't guess.
We engineer.

Most agencies show up, throw spaghetti at the algorithm, and call it strategy. We've watched ecommerce founders burn six-figure budgets on "tests" that nobody could explain. That's not advertising. That's gambling with extra steps.

So we built something different — a repeatable, three-phase system that takes the guesswork out of paid acquisition. Every dollar has a job. Every test has a hypothesis. Every metric ladders up to the only one that matters: your revenue, growing predictably, month after month.

01

Diagnose the leaks.

Deep audit of your account, attribution, audience structure, and creative library. We map exactly where revenue is leaking before we plug a single hole. Most brands skip this — which is exactly why most brands plateau.

Account audit Attribution map Funnel diagnosis
02

Engineer the system.

Server-side tracking, structured creative testing, lifecycle email/SMS flows, full-funnel campaign architecture. Built on documented frameworks, not vibes. The first 30 days are about installing the machine.

Server-side tracking Lifecycle flows
03

Compound & scale.

Once unit economics are predictable, we pour fuel. Weekly creative drops, daily optimisation, monthly strategy reviews. This is the phase where five-figure months quietly become seven-figure quarters.

Daily optimisation Creative iteration Strategic scale
The receipts vs the room

What every agency promises.
What we actually deliver.

The metric
DTC industry average
Vishani Media partners
Blended ROASReturn on every $1 of ad spend
2-3×
5.8-6.7×
Cost per purchaseWhat you pay to acquire a customer
$25-40
$14-16
Returning customer rateRepeat purchase rate over 12 months
~27%
41.34%
5-figure → 7-figure timelineTime to break $1M in annual revenue
2-3 years
8-12 months
Year-on-year sales growthTop-performing partner, last 12 months
10-30%
+323%

Industry benchmarks sourced from Shopify, Klaviyo, and Triple Whale 2025 DTC reports. Vishani figures are pulled directly from live Meta Ads Manager and Shopify Analytics dashboards across active partner accounts. We're happy to show you the receipts on a call — screen-shared, no slide deck.

Order #4827 · #4828 · #4829...

This is what a working system sounds like.

While most ecommerce brands chase sales, our partners receive them. Continuously. Predictably. Often while they sleep. Below is a live-style preview of what the order stream looks like during a peak window on one of our active accounts — pulled from real Shopify notification patterns.

$614K
Revenue generated · 12 months · one partner
5,873
Orders fulfilled · same window
9:41
Wednesday, May 20
9:41
+323%
Total sales · YoY growth on same account
~8min
Average gap between orders · peak window
That sound? It's predictable revenue. Want your phone to do this?
One day · one partner · real Shopify data

And then there are days like this.

On a regular weekday — not Black Friday, not a launch — one of our partner stores did $20,055.22 in revenue. 272 orders. A 10.59% conversion rate. That's a +527% lift over their prior daily average. The cash register, that day, simply did not stop.

This isn't a fluke. It's what happens when paid acquisition, lifecycle flows, and conversion infrastructure all start firing in the same direction. Most agencies dream of a screenshot like this. We pulled this one from a Tuesday.

$20K+ Single-day revenue ↑ 527% vs avg
272 Orders in one day ↑ 563% vs avg
10.59% Conversion rate ↑ 259% vs avg
★ Real screenshot · verified
Shopify mobile dashboard captured on a peak day: $20,055.22 in total sales (+527% vs prior day average), 272 total orders (+563%), 10.59% conversion rate (+259%), with hourly sales peaking around 10:00 AM
Real partners · real numbers

Results aren't promised here.
They're produced.

S Performance partner to Shopify ecommerce brands
Discuss your account →
Case 01 · DTC scaling · 15 months

From quiet five-figure months to $741K in gross sales.

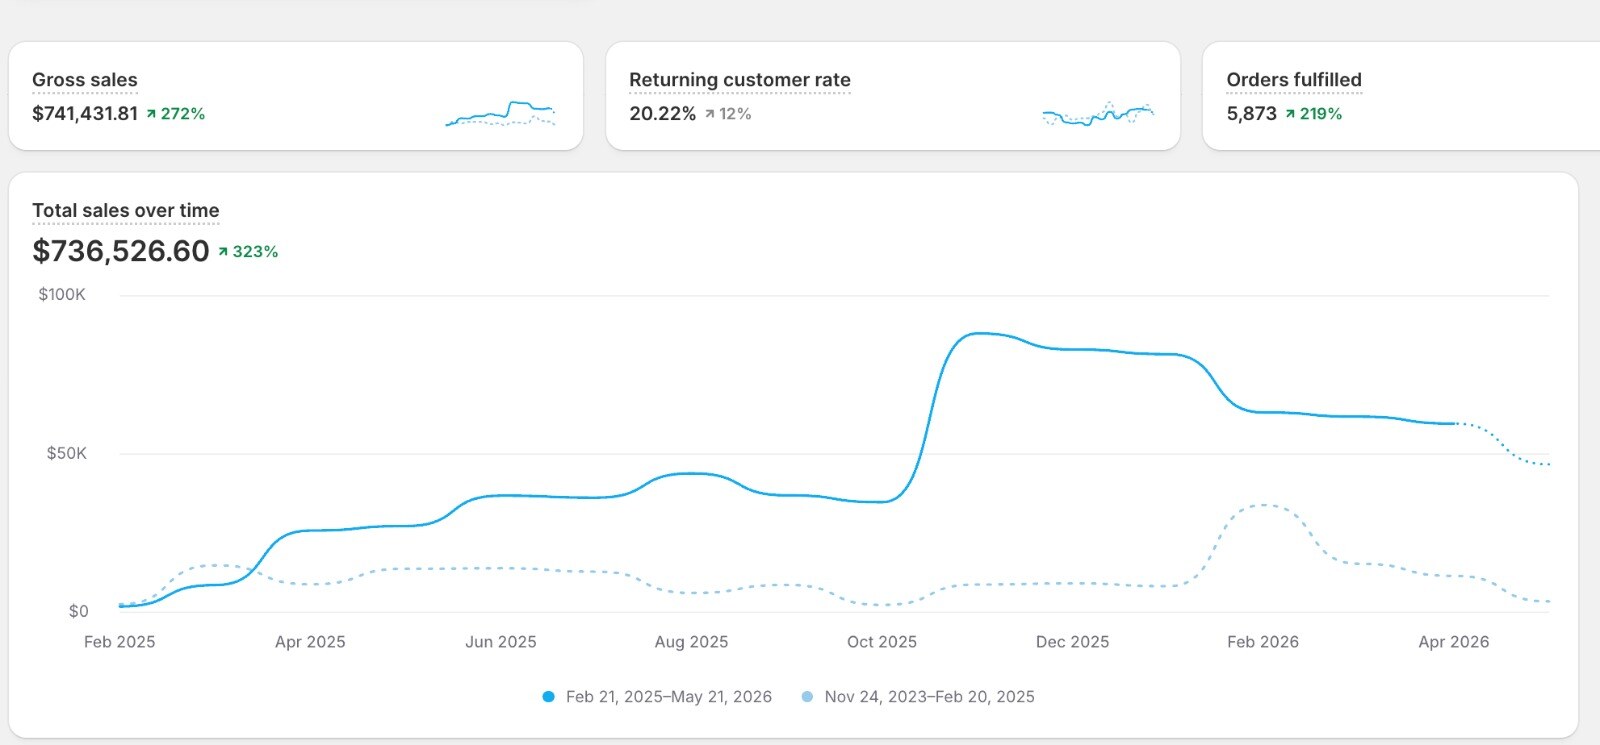
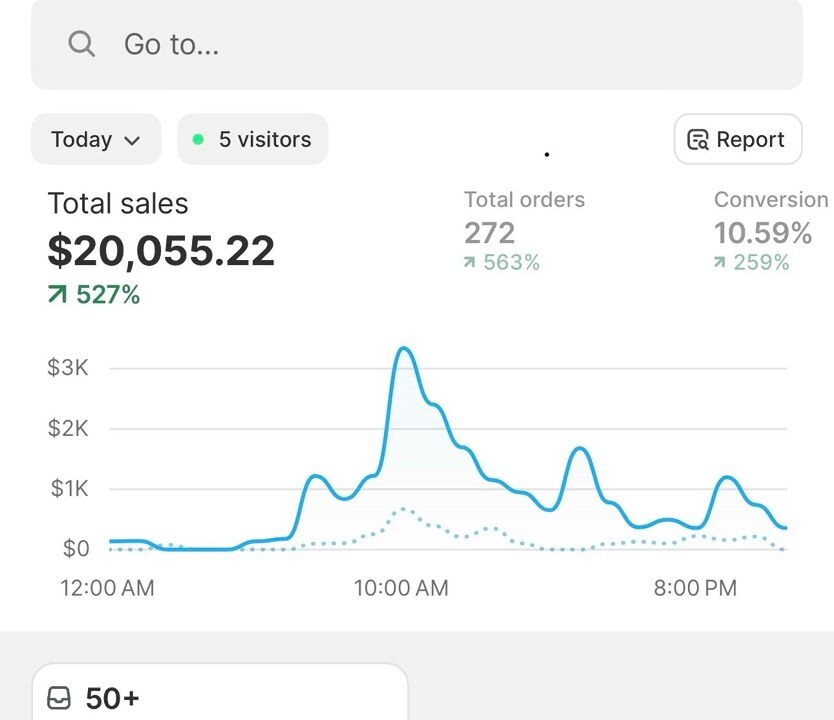
A DTC brand stuck under $100K/quarter when we took over. Within 8 months of installing the Vishani Media System, monthly revenue more than tripled. The Shopify chart tells the story — a gradual climb through diagnosis and engineering, then a clean step-change in October once the scale phase kicked in.

Gross sales (12mo)
$741K
↑ 272% YoY
Total sales growth
+323%
↑ vs. prior year
Orders fulfilled
5,873
↑ 219% YoY
Ad spend → revenue
$91K → $614K
6.7× blended ROAS
S
Shopify Analytics · screenshot
Feb '25 – May '26
+323% Verified
Shopify Analytics dashboard showing $741,431.81 gross sales (+272% YoY), $736,526.60 total sales (+323%), 5,873 orders fulfilled (+219%), with a step-change in revenue beginning October 2025
S
Shopify Analytics · screenshot
May '25 – May '26
A$1.16M Verified
Shopify Analytics dashboard: A$1,160,177.80 gross sales (+11% YoY), 41.34% returning customer rate (+12%), 8,524 orders fulfilled (+6%), with peak monthly revenue around A$145K in December
Case 02 · Australian apparel · Multi-year

A loyalty machine doing A$1.16M a year — at a 41% repeat rate.

When ad costs are rising and acquisition is the hardest it's ever been, this brand has quietly built one of the best returning customer engines in DTC. Industry average for returning customer rate is around 27%. Theirs sits at 41.34% — which means almost half their revenue compounds for free. Multi-year view: A$4.38M in tracked sales, +45% growth on an already mature base.

Gross sales (12mo)
A$1.16M
↑ 11% YoY
Returning customers
41.34%
vs. ~27% industry avg
Cost per purchase
A$14.25
↓ 60% below avg
Peak campaign ROAS
9.83×
3× industry benchmark
Case 03 · Multi-year compounding · 4 years

What systematic scaling looks like over four years.

This is what happens when an ecommerce brand stops chasing tactics and runs a real system. Year over year over year, the curve keeps bending up. A$4.38M in gross sales last year alone — a 45% jump on an already-strong base of A$3M+. Over 34,000 orders shipped. The compounding effect of doing performance right.

Lifetime gross sales
A$4.38M
↑ 45% latest year
Total sales growth
+44%
YoY on mature base
Orders fulfilled
34,265
↑ 8% YoY
Returning customers
35.33%
Well above DTC avg
S
Shopify Analytics · screenshot
2021 – 2025
+45% Verified
Shopify Analytics multi-year view: A$4,383,251.97 gross sales (+45%), 35.33% returning customer rate (+12%), 34,265 orders fulfilled (+8%), with A$3.79M total sales (+44%) and a clear upward trajectory from 2021 to 2025
S
Shopify mobile · screenshot
Jan – Oct 2024 vs 2023
+98% Verified
Shopify mobile dashboard: $749,750.53 total sales (+98% YoY), with Sales by channel showing Online Store at $495.2K (+66%) and Facebook & Instagram at $167.1K (+364%) — up from just $36K the prior year
Case 04 · Multi-channel scaling · YoY

A 98% jump in total sales — and a 364% explosion on Meta.

The headline number — $749K in tracked sales, +98% year-over-year — is the kind of growth most agencies frame as a fluke. The story underneath is more useful: the Facebook & Instagram channel went from $36K to $167K in twelve months. That's not a lift, that's a different brand operating in the same domain. This is what happens when paid social isn't a side experiment — it's an engineered channel.

Total sales · YoY
$749K
↑ 98% YoY
Meta channel growth
+364%
$36K → $167K
Best single day
$20K+
↑ 527% vs avg
Best day · orders
272
10.59% conv rate
What we run

Every channel.
One playbook.

Get a custom proposal →
01

Growth strategy

The diagnostic foundation. Account audits, attribution mapping, growth modelling — we figure out what's actually broken before anyone touches a campaign.

02

Meta & TikTok ads

Facebook, Instagram, TikTok, Pinterest, Snapchat. Creative-first campaign architecture that compounds — built on documented frameworks, not vibes.

03

Google & YouTube

Shopping, paid search, Performance Max, YouTube. Full-funnel coverage where the highest-intent buyers actually are — at the moment they're ready to buy.

04

Email & SMS

Klaviyo, Attentive, Postscript. The owned channels that take one-time buyers and turn them into 4× repeat customers. The compounding engine behind the 41% retention rate.

05

Tracking & attribution

Server-side tracking, custom dashboards, CAPI, Triple Whale setups. The data infrastructure that makes everything else trustworthy. iOS didn't kill measurement — bad setups did.

Founder voices
"We went from burning $40K a month with no idea why
to a system where every dollar has a job.
I sleep again."
M
Maya R.
Founder · DTC Apparel · Active Partner

Ready to stop
guessing?

We take on 3 new partners per quarter. If your brand is doing $10K+/month and you're ready to install a real growth system — let's talk.

Book your strategy call Free · 30 minutes · No slide deck